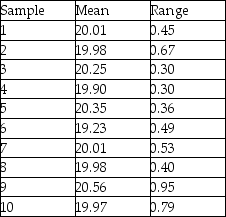
Ten samples of size four were taken from a process,and their weights measured.The sample averages and sample ranges are in the following table.Construct and plot an x-bar and R-chart using this data.Is the process in control?
Correct Answer:
Verified
View Answer
Unlock this answer now
Get Access to more Verified Answers free of charge
Q129: A small,independent amusement park collects data on
Q130: Cartons of Plaster of Paris are supposed
Q132: The mean and standard deviations for a
Q132: A part that connects two levels should
Q135: A quality analyst wants to construct a
Q136: Pierre's Motorized Pirogues and Mudboats is setting
Q137: McDaniel Shipyards wants to develop control charts
Q138: Pierre's Motorized Pirogues and Mudboats is setting
Q139: Pierre's Motorized Pirogues and Mudboats is setting
Q140: A local manufacturer supplies you with parts,
Unlock this Answer For Free Now!
View this answer and more for free by performing one of the following actions

Scan the QR code to install the App and get 2 free unlocks

Unlock quizzes for free by uploading documents