A quality analyst wants to construct a sample mean chart for controlling a packaging process.He knows from past experience that when the process is operating as intended,packaging weight is normally distributed with a mean of twenty ounces,and a process standard deviation of two ounces.Each day last week,he randomly selected four packages and weighed each.The data from that activity appears below. 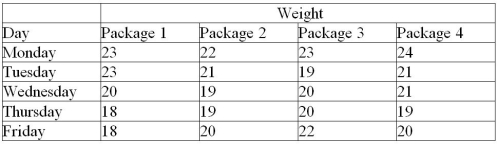 (a)If he sets an upper control limit of 21 and a lower control limit of 19 around the target value of twenty ounces,what is the probability of concluding that this process is out of control when it is actually in control?
(b)With the UCL and LCL of part a,what do you conclude about this process-is it in control?
Correct Answer:
Verified
View Answer
Unlock this answer now
Get Access to more Verified Answers free of charge
Q67: Repeated sampling of a certain process shows
Q102: Define consumer's risk. How does it relate
Q103: Why doesn't acceptance sampling remove all defects
Q104: Why are x-bar and R-charts usually used
Q130: A hospital-billing auditor has been inspecting patient
Q140: A woodworker is concerned about the quality
Q169: Briefly explain what the Central Limit Theorem
Q183: Why do range charts exist? Aren't x-bar
Q186: The width of a bronze bar is
Q252: What do the terms producer's risk and
Unlock this Answer For Free Now!
View this answer and more for free by performing one of the following actions

Scan the QR code to install the App and get 2 free unlocks

Unlock quizzes for free by uploading documents