A quality analyst wants to construct a sample mean chart for controlling a packaging process.He knows from past experience that the process standard deviation is two ounces.Each day last week,he randomly selected four packages and weighed each.The data from that activity appear below.
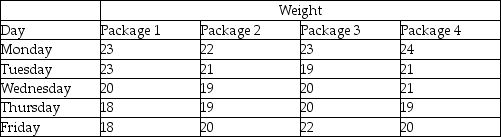 (a)Calculate all sample means and the mean of all sample means.
(b)Calculate upper and lower 2-sigma x-bar chart control limits that allow for natural variations.
(c)Based on the x-bar chart,is this process in control?
Correct Answer:
Verified
View Answer
Unlock this answer now
Get Access to more Verified Answers free of charge
Q67: Repeated sampling of a certain process shows
Q73: McDaniel Shipyards wants to develop a control
Q77: A part that connects two levels should
Q80: Larry's boat shop wants to monitor the
Q96: The process capability measures Cp and Cpk
Q97: The specifications for a manifold gasket that
Q190: If μ = 9 ounces, σ =
Q192: What is the difference between natural and
Q200: A local manufacturer supplies you with parts,
Q206: A process is operating in such a
Unlock this Answer For Free Now!
View this answer and more for free by performing one of the following actions

Scan the QR code to install the App and get 2 free unlocks

Unlock quizzes for free by uploading documents