The graphs below show the frequency of the b+ allele over twenty generations in two populations of heterozygous flour beetles (data for a population of ten individuals is shown in graph A; data for a population of one hundred individuals is shown in graph B) .Why does the frequency of the b+ allele increase in both populations? 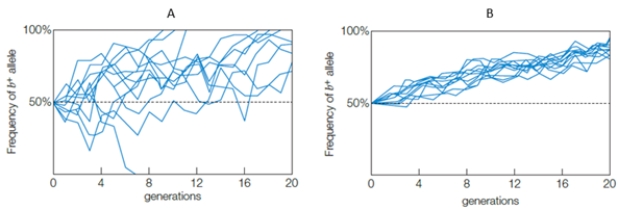
A) b+ is a lethal allele
B) b+ is a balanced polymorphism
C) b+ is a fixed allele
D) the b+ allele is adaptive
E) b+ is a neutral mutation
Correct Answer:
Verified
Q21: A random change in allele frequency over
Q22: In a population of rabbits, those able
Q23: What is one result of the bottleneck
Q24: In a tropical forest, some leaves are
Q25: Which population is more likely to be
Q26: The movement of alleles among populations is
Q27: In Cameroon, seedcrackers have either small bills
Q30: The increased variability in the frequency of
Q31: In the universal ABO blood grouping system,
Q39: Exposure of wild rat populations to warfarin
Unlock this Answer For Free Now!
View this answer and more for free by performing one of the following actions

Scan the QR code to install the App and get 2 free unlocks

Unlock quizzes for free by uploading documents