The accompanying data were compiled by the superintendent of schools in a large metropolitan area. The table shows the average SAT verbal scores of high school seniors during the 5 years since the district implemented its "back-to-basics" program.  Determine the equation of the least-squares line for these data.
A) 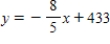
B) 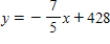
C) 
D) 
E) 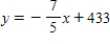
Correct Answer:
Verified
Q252: The management of a manufacturing company submitted
Q253: The Social Security (FICA) wage base (in
Q254: Find the equation of the least-squares line
Q255: The accompanying data were compiled by the
Q256: Draw a scatter diagram for the data
Q258: According to industry sources, online banking is
Q259: The accompanying table gives the projected online
Q260: The size of the average farm in
Q261: Determine whether the statement is true or
Q262: With computer security always a hot-button issue,
Unlock this Answer For Free Now!
View this answer and more for free by performing one of the following actions

Scan the QR code to install the App and get 2 free unlocks

Unlock quizzes for free by uploading documents