Examine the graph below, which shows the distribution of the magnitude of gene effects for the different genes contributing to a complex trait. Which of the following statements accurately describes what the graph shows? 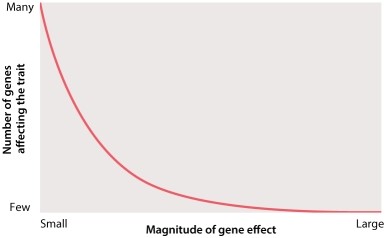
A) Most often, a single gene with a small effect has a large effect on a complex trait.
B) Most genes that affect a complex trait have relatively large effects.
C) Most often, multiple genes with large effects are the sole contributors to complex traits.
D) It is easier to identify genes for a complex trait if you examine many genes with a lower magnitude of effect.
E) Most genes that affect a complex trait have relatively small effects.
Correct Answer:
Verified
Q146: All of the genes involved in a
Q147: Genetic mapping of inherited risk factors that
Q148: A premise of personalized medicine is that
Q149: Pleiotropy refers to:
A)the interaction of two genes
Q150: Which of the following statements is TRUE
Q152: Personalized medicine matches the treatment to the
Q153: Which of the following birth anomalies are
Q154: Clustering of genes with related functions on
Q155: The multiple genetic and environmental factors affecting
Q156: If the concordance rate between identical twins
Unlock this Answer For Free Now!
View this answer and more for free by performing one of the following actions

Scan the QR code to install the App and get 2 free unlocks

Unlock quizzes for free by uploading documents