In the graph of Galton's height data below, which line on the graph represents the average height of the parents in a mating? 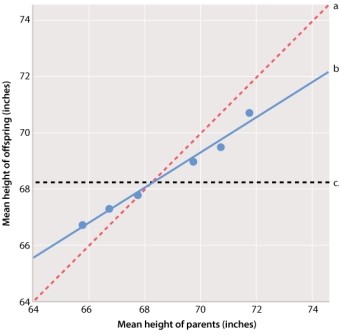
A) line a
B) line b
C) line c
Correct Answer:
Verified
Q68: Nilsson-Ehle's studies of seed color in wheat
Q69: Which of the traits in the
Q70: When heritability is 100%, the variation among
Q71: If all variation among individuals in a
Q72: In which of the complex traits shown
Q74: Which of the traits depicted here illustrates
Q75: When heritability is 100%, the environment plays:
A)no
Q76: Which of the traits depicted here has
Q77: The scatterplots show the relation between the
Q78: When the average weight of the parents
Unlock this Answer For Free Now!
View this answer and more for free by performing one of the following actions

Scan the QR code to install the App and get 2 free unlocks

Unlock quizzes for free by uploading documents