The graph in Figure 22.9, below, shows that the extent of the adaptive radiation of the Galápagos finches is correlated with the number of islands present in the archipelago. What can be concluded from the graph? 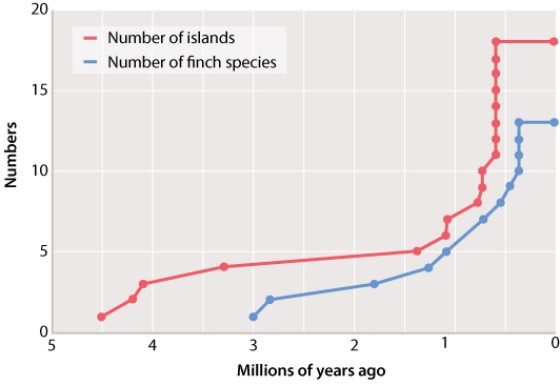
A) This shows that rates of speciation are correlated with the net total land area available.
B) This shows that each island hosts sympatrically speciating populations.
C) This shows that opportunities for geographic isolation are a key component of the speciation process.
D) This shows that allopatric speciation tends not to occur on islands.
E) This shows that the balance between rates of sympatric and allopatric speciation is governed by mutation rates.
Correct Answer:
Verified
Q33: All members of a species can in
Q34: When we look at islands across the
Q35: If two populations are reproductively isolated from
Q36: The example of speciation via vicariance given
Q37: A researcher finds two closely related species
Q39: Which of the following statements is TRUE
Q40: Horses and donkeys can interbreed, but their
Q41: Imagine that a researcher discovers two new
Q42: Imagine a very deep lake with multiple
Q43: If two individuals from different species attempt
Unlock this Answer For Free Now!
View this answer and more for free by performing one of the following actions

Scan the QR code to install the App and get 2 free unlocks

Unlock quizzes for free by uploading documents