(Figure: The Home Monopolist's Market) The graph shows a home monopolist market with free trade and with the imposition of a tariff. After the imposition of the tariff, the home monopolist's production increased by ______ and the country's producer surplus increased by ________. 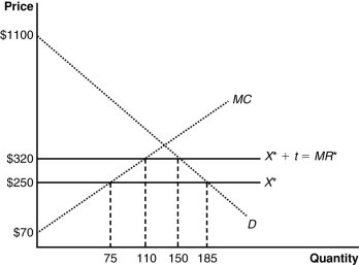
A) 55 units; $5,250
B) 75 units; $1,225
C) 100 units; $6,475
D) 35 units; $6,475
Correct Answer:

Verified
Q40: What is the outcome when the home
Q41: (Figure: Supply and Demand at Home) With
Q42: (Figure: Supply and Demand at Home) With
Q43: (Figure: The Home Monopolist's Market) The graph
Q44: When we compare a tariff levied on
Q46: (Figure: The Home Monopolist's Market) The graph
Q47: (Figure: The Home Monopolist's Market) The graph
Q48: (Figure: The Home Monopolist's Market) The graph
Q49: For a home monopolist, a quota allows
Q50: The WTO has encouraged nations to replace
Unlock this Answer For Free Now!
View this answer and more for free by performing one of the following actions

Scan the QR code to install the App and get 2 free unlocks

Unlock quizzes for free by uploading documents