The following table shows real GDP and potential real GDP for the years 2005-2015. Refer to this table when answering the following questions.
Table 10.1 ($ billions) 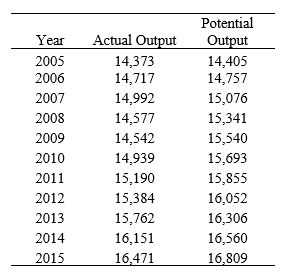 (Source: Federal Reserve Economic Data, St. Louis Federal Reserve)
-About how much did short-run output equal in 2009 and 2015, respectively?
A) -6.4 percent; -2.0 percent
B) 6.9 percent; 2.1 percent
C) 93.6 percent; 98.0 percent
D) 106.9 percent; 102.1 percent
E) Not enough information is given.
Correct Answer:
Verified
Q49: Refer to the following table when answering
Q50: The sharp swing in core inflation in
Q51: Refer to the following table when answering
Q52: The average decline in GDP growth for
Q53: Which of the following countries did the
Q55: Refer to the following table when answering
Q56: According to the IMF, which of these
Q57: From a low of _ percent in
Q58: The following table shows real GDP and
Q59: In terms of loss of employment, which
Unlock this Answer For Free Now!
View this answer and more for free by performing one of the following actions

Scan the QR code to install the App and get 2 free unlocks

Unlock quizzes for free by uploading documents