Demographic Variables and TV Narrative
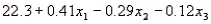
A statistician wanted to determine if the demographic variables of age, education, and income influence the number of hours of television watched per week. A random sample of 25 adults was selected to estimate the multiple regression model:  , where y is the number of hours of television watched last week,
  is the age (in years),
  is the number of years of education, and
  is income (in $1000s). The computer output is shown below.
The regression equation is 
 S = 4.51 R-Sq = 34.8%
Analysis of Variance 
-Refer to Eating Habits of Canadians. Write the equations of the two straight lines that describe the trend in consumption over the period of 30 years for beef and for chicken.
Correct Answer:
Verified
View Answer
Unlock this answer now
Get Access to more Verified Answers free of charge
Q196: College Textbook Sales Narrative
A publisher of college
Q197: College Textbook Sales Narrative
A publisher of college
Q198: College Textbook Sales Narrative
A publisher of college
Q199: College Textbook Sales Narrative
A publisher of college
Q200: Chemical Comparisons Narrative
A chemist was interested in
Q202: Life Expectancy Narrative
An actuary wanted to develop
Q203: Life Expectancy Narrative
An actuary wanted to develop
Q204: Demographic Variables and TV Narrative
A statistician wanted
Q205: Demographic Variables and TV Narrative
A statistician wanted
Q206: Life Expectancy Narrative
An actuary wanted to develop
Unlock this Answer For Free Now!
View this answer and more for free by performing one of the following actions

Scan the QR code to install the App and get 2 free unlocks

Unlock quizzes for free by uploading documents