The figure below shows the nodes (A-I) and capacities (labelled on arcs in packages/day) of a shipping network. The firm would like to know how many packages per day can flow from node A to node I. 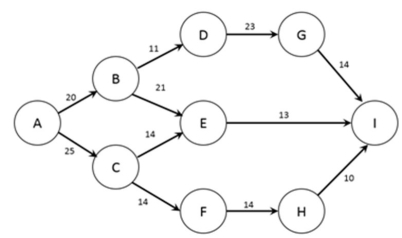 Note: This question requires Solver.
Formulate the problem in Solver and find the optimal solution. At maximum capacity, what will be the flow between nodes B and E?
A) 9 packages/day
B) 11 packages/day
C) 16 packages/day
D) 21 packages/day
E) 26 packages/day
Correct Answer:
Verified
Q74: The figure below shows the nodes (A-I)
Q75: The figure below shows the nodes (A-I)
Q76: The figure below shows the nodes (A-I)
Q77: The figure below shows the possible routes
Q78: The figure below shows the nodes (A-I)
Q80: The figure below shows the possible routes
Q81: The figure below shows the possible routes
Q82: The figure below shows the possible routes
Q83: The figure below shows the possible routes
Q84: The figure below shows the possible routes
Unlock this Answer For Free Now!
View this answer and more for free by performing one of the following actions

Scan the QR code to install the App and get 2 free unlocks

Unlock quizzes for free by uploading documents