The diagram below shows the activities on the nodes, and the table shows the normal time and crash time (in days) and cost for each activity.
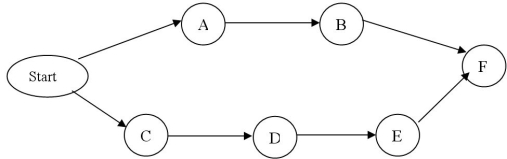
-Determine which activities should be crashed to shorten the project by 3 days. What is the cost?
Correct Answer:
Verified
View Answer
Unlock this answer now
Get Access to more Verified Answers free of charge
Q58: When the earliest start time (ES) of
Q59: In an AOA network, a _ activity
Q60: A _ shows who in the organization
Q61: Once a project is underway, the project
Q62: Consider the following network. Q64: Consider the following network. Q65: Given the following information for a Q66: Consider the following network. Q67: Consider the following network. Q68: Refer to the table below to Unlock this Answer For Free Now! View this answer and more for free by performing one of the following actions Scan the QR code to install the App and get 2 free unlocks Unlock quizzes for free by uploading documents
![]()
![]()
![]()
![]()

