A distributor of electronics is doing a customer satisfaction survey for a manufacturer of tablet computers.A sample of 68 clients is asked to rate a particular tablet on appearance,functionality,ease of use,and price on a scale of 1 to 10,where 1 corresponds to the worst rating and 10 to the best possible rating.A bar graph of the ease of use ratings classified by gender is given below. 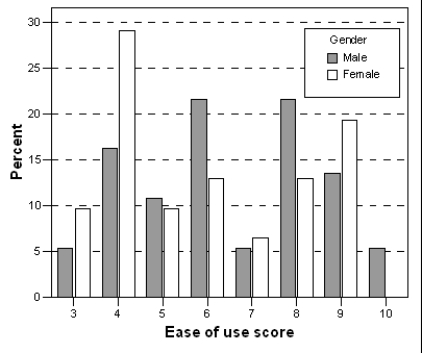 What percentage of the sampled female clients rated the tablet as not so easy to use (a rating of 4 or lower) ?
A) 28%
B) 29%
C) 38%
D) 62%
Correct Answer:
Verified
Q36: Consider the following data which describe the
Q37: Categorical variables are best displayed by _.
A)histograms
B)pie
Q38: Consider the following data which describe the
Q39: Consider the following data which describe the
Q40: When using a pie chart,the sum of
Q42: The Consumers Union measured the gas mileage
Q43: When using a histogram to display categorical
Q44: During the early part of the 1994
Q45: A study is being conducted on air
Q46: A sample of employees of a large
Unlock this Answer For Free Now!
View this answer and more for free by performing one of the following actions

Scan the QR code to install the App and get 2 free unlocks

Unlock quizzes for free by uploading documents