The following scatter plot and SPSS output represent data collected on 89 middle-aged people.The relationship between body weight and percent body fat is to be studied. 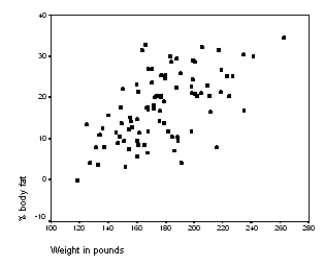
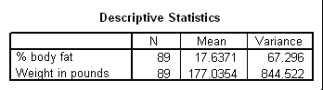
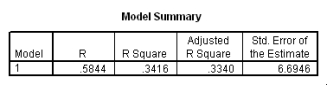
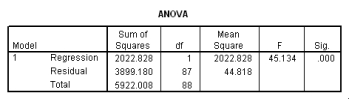
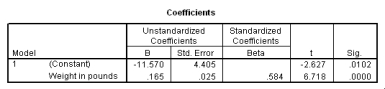 Is the slope significantly different from zero? Include the value of the test statistic and the corresponding P-value in your answer.
Correct Answer:
Verified
View Answer
Unlock this answer now
Get Access to more Verified Answers free of charge
Q63: A study was conducted to monitor the
Q64: The following scatter plot and SPSS
Q65: In the National Football League (NFL),having
Q66: In the National Football League (NFL),having an
Q67: A recent study was done to assess
Q69: A recent study was done to assess
Q70: A study was conducted to monitor the
Q71: The following scatter plot and SPSS output
Q72: A study was conducted to monitor the
Q73: A study was conducted to monitor
Unlock this Answer For Free Now!
View this answer and more for free by performing one of the following actions

Scan the QR code to install the App and get 2 free unlocks

Unlock quizzes for free by uploading documents