Your textbook mentions use of a quasi-experiment to study the effects of minimum wages on employment using data from fast food restaurants.In 1992,there was an increase in the (state)minimum wage in one U.S.state (New Jersey)but not in neighboring location (Eastern Pennsylvania).To calculate the  you need the change in the treatment group and the change in the control group.To do this,the study provides you with the following information
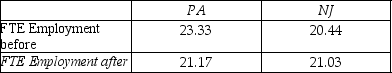 Where FTE is "full time equivalent" and the numbers are average employment per restaurant.
(a)Calculate the change in the treatment group,the change in the control group,and finally  .Since minimum wages represent a price floor,did you expect
  to be positive or negative?
(b)If you look at  ,is this number primarily due to a change in the treatment group or the control group? Is this what you expected?
(c)The standard error for  is 1.36.Test whether or not the coefficient is statistically significant,given that there are 410 observations.If you believed that the benefit from small minimum wage increases outweighed the cost in terms of employment loss,would finding that this coefficient was not statistically significant discourage you?
Correct Answer:
Verified
View Answer
Unlock this answer now
Get Access to more Verified Answers free of charge
Q32: Canada and the United States had approximately
Q41: To analyze the effect of a minimum
Q42: The New Jersey-Pennsylvania study on the effect
Q42: Consider the simple population regression model where
Q45: Let the vertical axis of a figure
Q45: Present alternative estimators for causal effects using
Q46: (Requires Appendix material)Discuss how the differences-in-differences estimator
Q47: Your textbook gives a graphical example of
Q48: Specify the multiple regression model that contains
Q49: Define the ![]()
Unlock this Answer For Free Now!
View this answer and more for free by performing one of the following actions

Scan the QR code to install the App and get 2 free unlocks

Unlock quizzes for free by uploading documents