The Economic Report of the President gives the following age distribution of the United States population for the year 2000:
United States Population By Age Group,2000
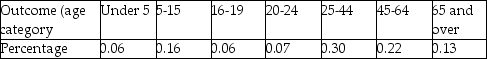 Imagine that every person was assigned a unique number between 1 and 275,372,000 (the total population in 2000).If you generated a random number,what would be the probability that you had drawn someone older than 65 or under 16? Treating the percentages as probabilities,write down the cumulative probability distribution.What is the probability of drawing someone who is 24 years or younger?
Correct Answer:
Verified
View Answer
Unlock this answer now
Get Access to more Verified Answers free of charge
Q61: SAT scores in Mathematics are normally distributed
Q62: Use a standard spreadsheet program, such as
Q62: The accompanying table gives the outcomes and
Q63: The textbook mentioned that the mean of
Q64: The textbook formula for the variance of
Q65: Use a standard spreadsheet program,such as Excel,to
Q66: Looking at a large CPS data set
Q69: The accompanying table lists the outcomes and
Q70: Explain why the two probabilities are identical
Q71: Show that the correlation coefficient between Y
Unlock this Answer For Free Now!
View this answer and more for free by performing one of the following actions

Scan the QR code to install the App and get 2 free unlocks

Unlock quizzes for free by uploading documents