In a Monte Carlo study,econometricians generate multiple sample regression functions from a known population regression function.For example,the population regression function could be Yi = β0 + β1Xi = 100 - 0.5 Xi.The Xs could be generated randomly or,for simplicity,be nonrandom ("fixed over repeated samples").If we had ten of these Xs,say,and generated twenty Ys,we would obviously always have all observations on a straight line,and the least squares formulae would always return values of 100 and 0.5 numerically.However,if we added an error term,where the errors would be drawn randomly from a normal distribution,say,then the OLS formulae would give us estimates that differed from the population regression function values.Assume you did just that and recorded the values for the slope and the intercept.Then you did the same experiment again (each one of these is called a "replication").And so forth.After 1,000 replications,you plot the 1,000 intercepts and slopes,and list their summary statistics.
Sample: 1 1000
BETA0_HAT BETA1_HAT
Mean 100.014 -0.500
Median 100.021 -0.500
Maximum 106.348 -0.468
Minimum 93.862 -0.538
Std.Dev.1.994 0.011
Skewness 0.013 -0.042
Kurtosis 3.026 2.986
Jarque-Bera 0.055 0.305
Probability 0.973 0.858
Sum 100014.353 -499.857
Sum Sq.Dev.3972.403 0.118
Observations 1000.000 1000.000
Here are the corresponding graphs: 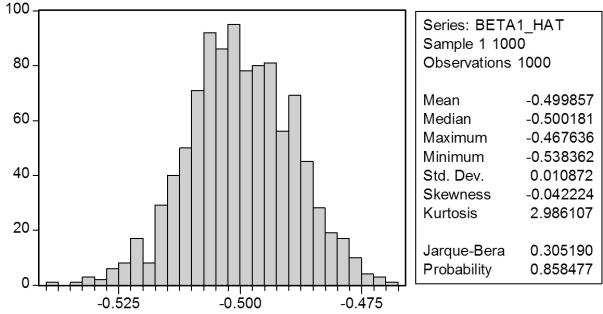
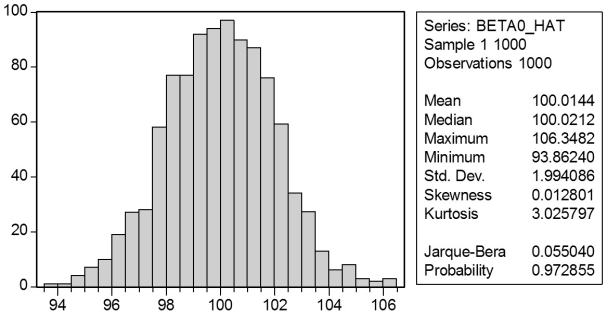 Using the means listed next to the graphs,you see that the averages are not exactly 100 and -0.5.However,they are "close." Test for the difference of these averages from the population values to be statistically significant.
Correct Answer:
Verified
View Answer
Unlock this answer now
Get Access to more Verified Answers free of charge
Q39: (Requires Appendix material from Chapters 4 and
Q40: Consider the estimated equation from your textbook
Q41: (Requires Appendix material)Your textbook shows that OLS
Q41: The effect of decreasing the student-teacher ratio
Q42: Using the California School data set from
Q43: Consider the sample regression function 
Q43: In many of the cases discussed in
Q46: Changing the units of measurement obviously will
Q48: Using data from the Current Population Survey,you
Q49: Consider the following two models involving binary
Unlock this Answer For Free Now!
View this answer and more for free by performing one of the following actions

Scan the QR code to install the App and get 2 free unlocks

Unlock quizzes for free by uploading documents