You are presented with the following output from a regression package,which reproduces the regression results of testscores on the student-teacher ratio from your textbook
Dependent Variable: TESTSCR
Method: Least Squares
Date: 07/30/06 Time: 17:44
Sample: 1 420
Included observations: 420 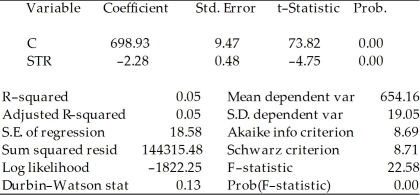 Std.Error are homoskedasticity only standard errors.
a)What is the relationship between the t-statistic on the student-teacher ratio coefficient and the F-statistic?
b)Next,two explanatory variables,the percent of English learners (EL_PCT)and expenditures per student (EXPN_STU)are added.The output is listed as below.What is the relationship between the three t-statistics for the slopes and the homoskedasticity-only F-statistic now?
Dependent Variable: TESTSCR
Method: Least Squares
Date: 07/30/06 Time: 17:55
Sample: 1 420
Included observations: 420 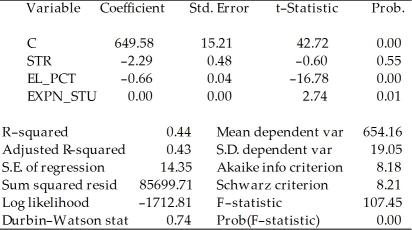
Correct Answer:
Verified
View Answer
Unlock this answer now
Get Access to more Verified Answers free of charge
Q55: Consider the following multiple regression model
Yi =
Q56: Set up the null hypothesis and alternative
Q57: Using the 420 observations of the California
Q58: Consider the regression model Yi = β0
Q59: Consider the regression output from the following
Q61: Analyzing a regression using data from a
Q62: You have estimated the following regression to
Q63: You have estimated the following regression to
Q64: Using the California School data set from
Q65: Looking at formula (7.13)in your textbook for
Unlock this Answer For Free Now!
View this answer and more for free by performing one of the following actions

Scan the QR code to install the App and get 2 free unlocks

Unlock quizzes for free by uploading documents