The figure shows is a plot and a fitted linear regression line of the age-earnings profile of 1,744 individuals,taken from the Current Population Survey. 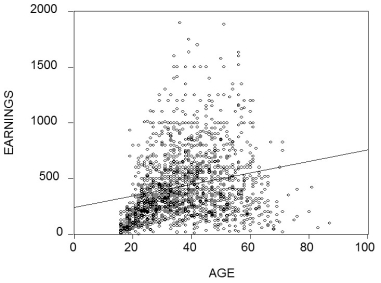 (a)Describe the problems in predicting earnings using the fitted line.What would the pattern of the residuals look like for the age category under 40?
(b)What alternative functional form might fit the data better?
(c)What other variables might you want to consider in specifying the determinants of earnings?
Correct Answer:
Verified
View Answer
Unlock this answer now
Get Access to more Verified Answers free of charge
Q41: (Requires Calculus)Show that for the log-log model
Q45: Your task is to estimate the ice
Q47: Many countries that experience hyperinflation do not
Q48: Suggest a transformation in the variables that
Q50: Show that for the following regression model
Yt
Q52: Being a competitive female swimmer,you wonder if
Q53: You have collected data for a cross-section
Q54: Indicate whether or not you can linearize
Q56: Sketch for the log-log model what the
Q58: You have estimated an earnings function, where
Unlock this Answer For Free Now!
View this answer and more for free by performing one of the following actions

Scan the QR code to install the App and get 2 free unlocks

Unlock quizzes for free by uploading documents