You have decided to analyze the year-to-year variation in temperature data.Specifically you want to use this year's temperature to predict next year's temperature for certain cities.As a result,you collect the daily high temperature (Temp)for 100 randomly selected days in a given year for three United States cities: Boston,Chicago,and Los Angeles.You then repeat the exercise for the following year.The regression results are as follows (heteroskedasticity-robust standard errors in parentheses):  = 18.19 + 0.75 ×
  ;R2 = 0.62,SER = 12.33
(6.46)(0.10)  = 2.47 + 0.95 ×
  ;R2 = 0.93,SER = 5.85
(3.98)(0.05)  = 37.54 + 0.44 ×
  ;R2 = 0.18,SER = 7.17
(15.33)(0.22)
(a)What is the prediction of the above regression for Los Angeles if the temperature in the previous year was 75 degrees? What would be the prediction for Boston?
(b)Assume that the previous year's temperature gives accurate predictions,on average,for this year's temperature.What values would you expect in this case for the intercept and slope? Sketch how each of the above regressions behaves compared to this line.
(c)After reflecting on the results a bit,you consider the following explanation for the above results.Daily high temperatures on any given date are measured with error in the following sense: for any given day in any of the three cities,say January 28,there is a true underlying seasonal temperature (X),but each year there are different temporary weather patterns (v,w)which result in a temperature  different from X.For the two years in your data set,the situation can be described as follows:
  = X + vt and
  = X + wt
Subtracting  from
from  ,you get
  =
=  + wt - vt.Hence the population parameter for the intercept and slope are zero and one,as expected.Show that the OLS estimator for the slope is inconsistent,where
 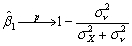 (d)Use the formula above to explain the differences in the results for the three cities.Is your mathematical explanation intuitively plausible?
Correct Answer:
Verified
View Answer
Unlock this answer now
Get Access to more Verified Answers free of charge
Q22: Possible solutions to omitted variable bias, when
Q25: A definition of internal validity is
A)the estimator
Q26: In the case of errors-in-variables bias,the precise
Q28: The guidelines for whether or not to
Q28: Your textbook used the California Standardized Testing
Q29: The Phillips curve is a relationship in
Q31: You try to explain the number of
Q31: Several authors have tried to measure the
Q32: A statistical analysis is internally valid if
A)all
Q37: The question of reliability/unreliability of a multiple
Unlock this Answer For Free Now!
View this answer and more for free by performing one of the following actions

Scan the QR code to install the App and get 2 free unlocks

Unlock quizzes for free by uploading documents