The following table shows analyst sentiment ratings for the 30 stocks listed in the Dow Jones Industrial Average. 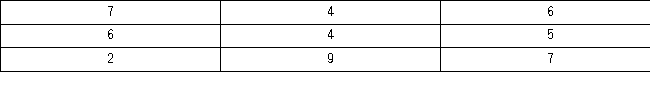 a.Construct a frequency distribution,relative frequency distribution,cumulative frequency distribution and relative cumulative frequency distribution using classes of 2 up to 4,4 up to 6,6 up to 8,and 8 up to 10.
b.Construct a histogram that summarizes the data.
c.What percentage of the stocks in the Dow Jones Industrial Average received a sentiment rating less than 8?
d.What percentage of the stocks in the Dow Jones Industrial Average received a sentiment rating of 6 or more?
Correct Answer:
Verified
View Answer
Unlock this answer now
Get Access to more Verified Answers free of charge
Q101: The following table lists some of the
Q102: The dividend yields of the stocks in
Q103: The following table displays the top 40
Q105: The following table shows the prices (in
Q105: A scatterplot depicts a positive _ relationship,
Q107: The following table shows average wind speeds
Q108: Johnson and Johnson (JNJ)is a consumer staples
Q110: Each month the Bureau of Labor Statistics
Q111: Construct a stem-and-leaf diagram with the following
Q113: When constructing a frequency distribution for quantitative
Unlock this Answer For Free Now!
View this answer and more for free by performing one of the following actions

Scan the QR code to install the App and get 2 free unlocks

Unlock quizzes for free by uploading documents