The statistics professor has kept attendance records and recorded the number of absent students per class.The recorded data is displayed in the following histogram with the frequency of each number of absent students shown above the bars. 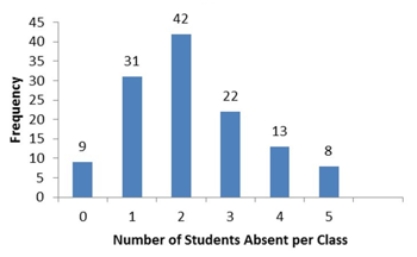 How many statistics classes had three or more students absent?
A) 8
B) 13
C) 22
D) 43
Correct Answer:
Verified
Q77: Automobiles traveling on a road with a
Q78: An analyst constructed the following frequency distribution
Q79: In the accompanying stem-and-leaf diagram,the values in
Q80: In the accompanying stem-and-leaf diagram,the values in
Q81: Use the following data to construct a
Q83: The following frequency distribution shows the frequency
Q84: What type of relationship is indicated in
Q85: Use the following data to construct a
Q86: The following frequency distribution shows the frequency
Q87: Consider the following stem-and-leaf diagram. 
Unlock this Answer For Free Now!
View this answer and more for free by performing one of the following actions

Scan the QR code to install the App and get 2 free unlocks

Unlock quizzes for free by uploading documents