The following data represent scores on a pop quiz in a statistics section: 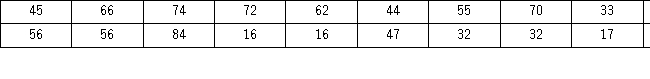 Suppose the data are grouped into five classes,and one of them will be "30 up to 44." that is,{x;30 ≤ x < 44}.The frequency of this class is _____.
A) 0.20
B) 0.25
C) 4
D) 5
Correct Answer:
Verified
Q39: Students in Professor Smith's business statistics course
Q40: In the following pie chart representing a
Q41: The following histogram represents the number of
Q42: The following data represent scores on a
Q43: The following data represent the recent sales
Q45: The following histogram represents the number of
Q46: Consider the following frequency distribution. 
Q47: Consider the following frequency distribution.
Q48: The following data represent the recent sales
Q49: Consider the following frequency distribution.
Unlock this Answer For Free Now!
View this answer and more for free by performing one of the following actions

Scan the QR code to install the App and get 2 free unlocks

Unlock quizzes for free by uploading documents