The following frequency distribution shows the monthly stock returns for Home Depot for the years 2003 through 2007. 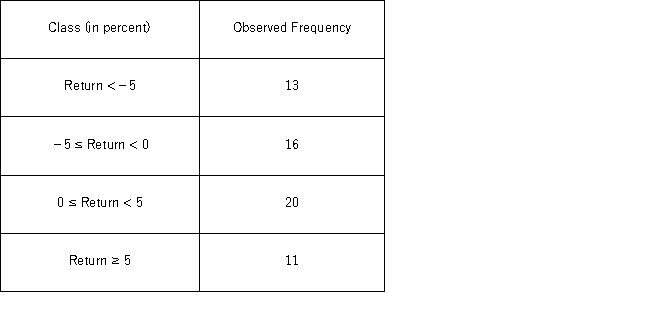 Over the time period,the following summary statistics are provided: Mean = 0.31%,Standard deviation = 6.49%,Skewness = 0.15,and Kurtosis = 0.38.At the 5% confidence level,which of the following is the correct conclusion for this goodness-of-fit test for normality?
A) Reject the null hypothesis;conclude that monthly stock returnsare normally distributed with mean 0.31% and standard deviation 6.49%.
B) Reject the null hypothesis;conclude that monthly stock returnsare not normally distributed with mean 0.31% and standard deviation 6.49%.
C) Do not reject the null hypothesis;conclude that monthly stock returnsare normally distributedwith mean 0.31% and standard deviation 6.49%
D) Do not reject the null hypothesis;conclude that monthly stock returnsare not normally distributed with mean 0.31% and standard deviation 6.49%.
Correct Answer:
Verified
Q83: The heights (in cm) for a random
Q88: The heights (in cm) for a random
Q96: A manufacturer of flash drives for data
Q99: The heights (in cm)for a random sample
Q100: The airline industry defines "no-shows" as passengers
Q103: Suppose Bank of America would like to
Q104: The following frequency distribution shows the monthly
Q105: A researcher wants to determine if the
Q106: The following frequency distribution shows the monthly
Q120: A travel agent wants to determine if
Unlock this Answer For Free Now!
View this answer and more for free by performing one of the following actions

Scan the QR code to install the App and get 2 free unlocks

Unlock quizzes for free by uploading documents