A researcher gathers data on 25 households and estimates the following model: Expenditure = β0 + β1 Income + ε.A residual plot of the estimated model is shown in the accompanying graph. 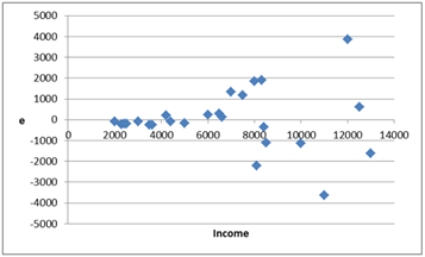 Which of the following can be inferred from the residual plot?
A) The residuals have little variation.
B) The residuals do not exhibit any pattern.
C) The residuals seem to fan out across the horizontal axis.
D) The residuals are evenly distributed across the horizontal axis.
Correct Answer:
Verified
Q39: Given the following portion of regression results,which
Q40: When testing r linear restrictions imposed on
Q42: Which of the following violates the assumptions
Q46: When confronted with multicollinearity, a good remedy
Q46: A sports analyst wants to exam the
Q47: A sports analyst wants to exam the
Q48: A sports analyst wants to exam the
Q49: A marketing analyst wants to examine the
Q53: One of the assumptions of regression analysis
Q58: Multicollinearity is suspected when _.
A) there is
Unlock this Answer For Free Now!
View this answer and more for free by performing one of the following actions

Scan the QR code to install the App and get 2 free unlocks

Unlock quizzes for free by uploading documents