The following data show the demand for an airline ticket dependent on the price of this ticket. 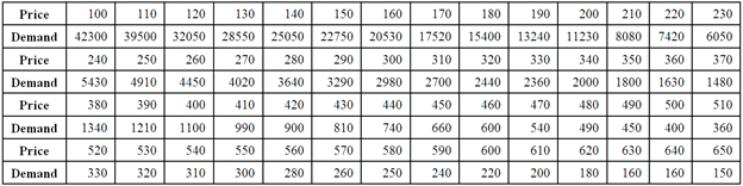 For the assumed cubic and log-log regression models,Demand = β0 + β1Price + β2Price2 + β3Price3 + ε and ln(Demand) = β0 + β1ln(Price) + ε,the following regression results are available.
 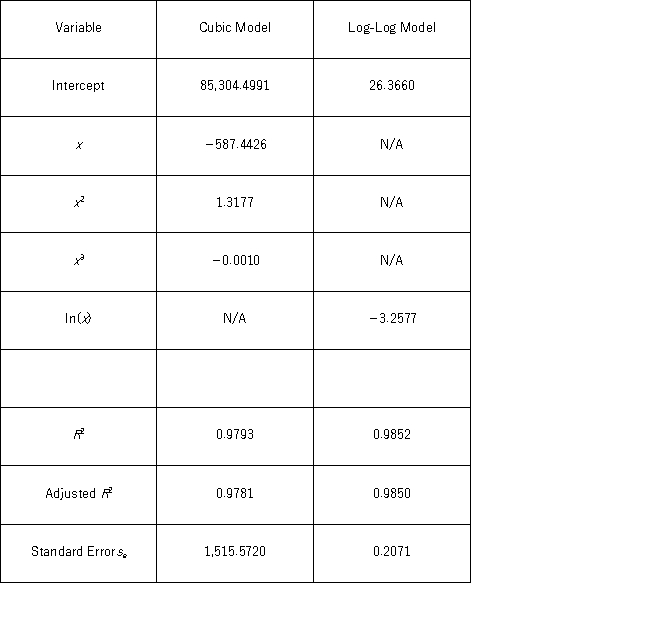 Which of the following is the percentage of variations in ln(Demand) explained by the log-log regression equation?
A) 98.52%
B) 98.50%
C) 91.39%
D) 97.93%
Correct Answer:
Verified
Q62: The following data show the demand for
Q63: The following data show the demand for
Q64: The following data,with the corresponding Excel scatterplot,show
Q65: The following data show the demand for
Q66: The logarithmic and log-log models,y = β0
Q68: Which of the following regression models is
Q69: The linear and logarithmic models,y = β0
Q70: The following data,with the corresponding Excel scatterplot,show
Q71: The following data,with the corresponding Excel scatterplot,show
Q72: Which of the following regression models is
Unlock this Answer For Free Now!
View this answer and more for free by performing one of the following actions

Scan the QR code to install the App and get 2 free unlocks

Unlock quizzes for free by uploading documents