The following Excel scatterplot with the fitted quadratic regression equation illustrates the observed relationship between productivity and the number of hired workers. 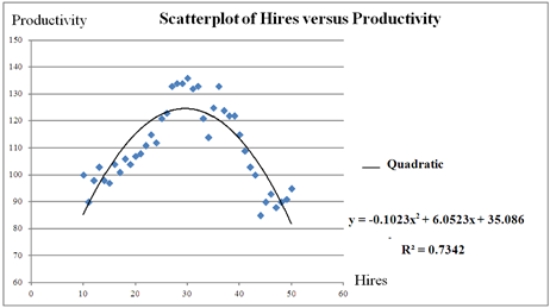 Which of the following is the predicted productivity when 32 workers are hired?
A) 124.00
B) 122.46
C) 121.60
D) 113.50
Correct Answer:
Verified
Q33: What is the effect of b2 <
Q34: Which of the following regression models is
Q36: The logarithmic model is especially attractive when
Q37: It is important to evaluate the estimated
Q37: An inverted U-shaped curve is also known
Q39: If the data are available on the
Q40: The following Excel scatterplot with the fitted
Q41: Typically,the sales volume declines with an increase
Q42: Typically,the sales volume declines with an increase
Q47: The coefficient of determination R2 cannot be
Unlock this Answer For Free Now!
View this answer and more for free by performing one of the following actions

Scan the QR code to install the App and get 2 free unlocks

Unlock quizzes for free by uploading documents