Figure 13-4 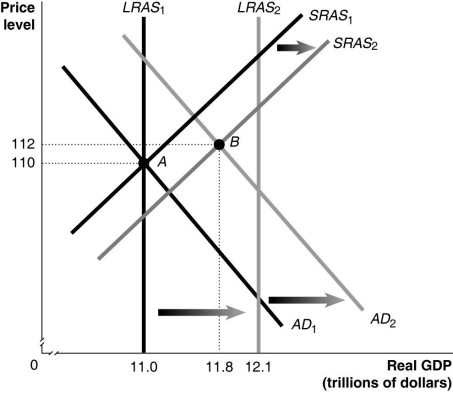
-Refer to Figure 13-4.In the figure above,AD1,LRAS1 and SRAS1 denote AD,LRAS and SRAS in year 1,while AD2,LRAS2 and SRAS2 denote AD,LRAS and SRAS in year 2.Given the economy is at point A in year 1,what is the actual growth rate in GDP in year 2?
A) 2.5%
B) 7.3%
C) 8.0%
D) 10.0%
Correct Answer:
Verified
Q201: In the long run
A)GDP = potential GDP.
B)unemployment
Q207: Explain how the economy moves back to
Q211: For the recession of 2007-2009,it took _
Q212: If rapid increases in oil prices caused
Q213: An increase in government spending will result
Q216: What is the relationship among the AD,SRAS
Q220: A rapid increase in the price of
Q227: Starting from long-run equilibrium,use the basic aggregate
Q229: Using the aggregate supply and demand model,illustrate
Q234: Beginning with long-run equilibrium,use the aggregate demand
Unlock this Answer For Free Now!
View this answer and more for free by performing one of the following actions

Scan the QR code to install the App and get 2 free unlocks

Unlock quizzes for free by uploading documents