The diagram shows the graphs of the stopping potential as a function of the frequency of the incident light for photoelectric experiments performed on three different materials. Rank the materials according to the values of their work functions, from least to greatest. 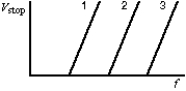
A) 1, 2, 3
B) 3, 2, 1
C) 2, 3, 1
D) 2, 1, 3
E) 1, 3, 2
Correct Answer:
Verified
Q6: The stopping potential for electrons ejected by
Q7: The quantization of energy, E = nhf,
Q8: The intensity of a light beam with
Q9: The concentration of photons in a uniform
Q10: In Compton scattering from stationary electrons the
Q11: The frequency of light beam A is
Q17: The work function for a certain sample
Q19: The units of the Planck constant h
Q21: Consider the following three particles: 
Q25: The frequency and wavelength of the matter
Unlock this Answer For Free Now!
View this answer and more for free by performing one of the following actions

Scan the QR code to install the App and get 2 free unlocks

Unlock quizzes for free by uploading documents