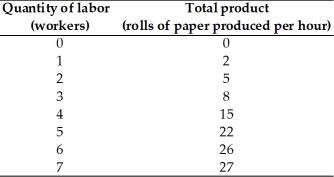
-The table above shows
A) a total product schedule.
B) the market for labor.
C) a production possibility frontier.
D) a supply schedule.
E) a demand for labor schedule.
Correct Answer:
Verified
Q217: The long-run average cost curve
A) is an
Q218: What does the long-run average cost curve
Q219: Q220: Q221: What resources can a firm change in Q224: The law of decreasing returns applies to Q225: Which of the following curves are U-shaped? Q226: Professor Rush decided to quit teaching economics Q227: As output increases,average total cost decreases Q339: What is a normal profit? Is it![]()
![]()
A)
i.average
A) constantly.
B)
Unlock this Answer For Free Now!
View this answer and more for free by performing one of the following actions

Scan the QR code to install the App and get 2 free unlocks

Unlock quizzes for free by uploading documents