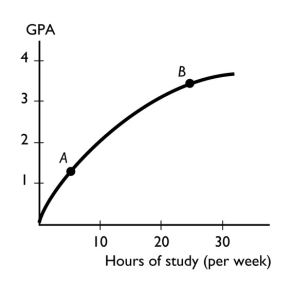
-The figure above shows the relationship between the time a student spends studying and the student's GPA that semester.The slope of the relationship at point A ________ the slope at point B.
A) is greater than
B) is less than
C) is equal to
D) cannot be compared to
E) can be compared but more information is needed to determine whether the slope is greater than, less than, or equal to
Correct Answer:
Verified
Q244: In the above figure,which of the figures
Q245: Q246: Q247: Q248: Q250: Q251: Which of the following statements is the Q252: The Latin term "ceteris paribus" means Q253: Q254: Unlock this Answer For Free Now! View this answer and more for free by performing one of the following actions Scan the QR code to install the App and get 2 free unlocks Unlock quizzes for free by uploading documents![]()
![]()
![]()
![]()
![]()
A) "false![]()
![]()

