Figure 8-1 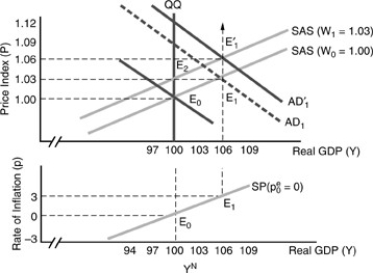
-Everywhere to the left of the long-run Phillips Curve as in the figure above
A) actual inflation is less than expected inflation and the expected inflation rate will be reduced.
B) actual inflation is less than expected inflation and the expected inflation rate will be raised.
C) actual inflation is greater than expected inflation and the expected inflation rate will be raised.
D) actual inflation is greater than expected inflation and the expected inflation rate will be reduced.
Correct Answer:
Verified
Q33: In the figure above, suppose that the
Q45: Stagflation may be explained by
A)an upward shift
Q61: As the output ratio falls below 100%,unemployment
A)falls
Q70: If nominal GDP growth has accelerated permanently
Q71: The growth of nominal GDP
A)can be broken
Q80: An increase in the rate of growth
Q112: In order for the economy to be
Q115: If people completely adjust for any error
Q131: An adverse supply shock will shift the
Q138: "Supply inflation" is caused by
A)exogenous disturbances such
Unlock this Answer For Free Now!
View this answer and more for free by performing one of the following actions

Scan the QR code to install the App and get 2 free unlocks

Unlock quizzes for free by uploading documents