Four samples of 100 each were taken from an assembly line,with the following results: 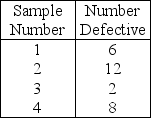 Using the historical average as the central line of the chart,which one of the following is the limits for an attributes control chart with z = 2?
A) UCL > 0.1 and LCL > 0.03
B) UCL > 0.1 and LCL < 0.03
C) UCL < 0.1 and LCL > 0.03
D) UCL < 0.1 and LCL < 0.03
Correct Answer:
Verified
Q15: A manufacturer of silk inspects each bolt
Q107: Historically, the average proportion of defective bars
Q134: A hotel tracks the number of complaints
Q135: A hotel tracks the number of complaints
Q149: Samples of 2000 were taken from an
Q150: Process capability can be addressed when:
A) assignable
Q151: A manufacturer of silk inspects each bolt
Q158: Table 6.4
The manager of Kewpie has
Q170: The upper and lower specification limits for
Q176: Which of the following statements is TRUE?
A)
Unlock this Answer For Free Now!
View this answer and more for free by performing one of the following actions

Scan the QR code to install the App and get 2 free unlocks

Unlock quizzes for free by uploading documents