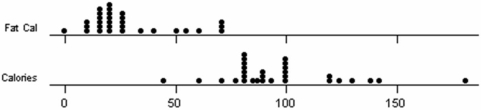
A team of introductory statistics students went to a grocery store and recorded the total calories and fat calories for various kinds of soup.They produced a table of statistics and two dot plots.Write a succinct summary of the center,variability,and shape for each data set.Note: TrimMean is the 5 percent trimmed mean (removing the smallest 5 percent and the largest 5 percent of the values,rounded to the nearest integer. 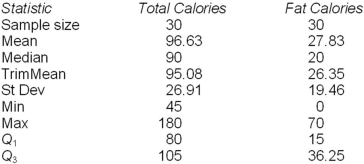
Correct Answer:
Verified
View Answer
Unlock this answer now
Get Access to more Verified Answers free of charge
Q105: Which is not a measure of variability?
A)Mean
Q112: Find the standard deviation of this sample:
Q114: In Tokyo, construction workers earn an average
Q118: The following table is the frequency distribution
Q120: The following frequency distribution shows the amount
Q122: Craig operates a part-time snow-plowing business using
Q123: Below are shown a dot plot and
Q124: Below are the ages of 21 CEOs.Find
Q125: Here are advertised prices of 21 used
Q126: Bob's sample of freshman GPAs showed a
Unlock this Answer For Free Now!
View this answer and more for free by performing one of the following actions

Scan the QR code to install the App and get 2 free unlocks

Unlock quizzes for free by uploading documents