What does the graph below (profit/sales ratios for 25 Fortune 500 companies) reveal? 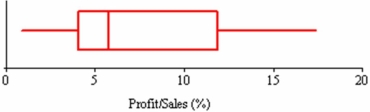
A) That the median exceeds the mean.
B) That the data are slightly left-skewed.
C) That the interquartile range is about 8.
D) That the distribution is bell-shaped.
Correct Answer:
Verified
Q74: Given a sample of three items (X
Q78: Three randomly chosen Michigan students were asked
Q79: The median of 600,800,1000,1200 is:
A) 800.
B) 1000.
C)
Q81: Twelve randomly chosen students were asked how
Q86: Craig operates a part-time snow-plowing business using
Q90: Twelve randomly chosen students were asked how
Q94: Which statistics offer robust (resistant to outliers)
Q104: A smooth distribution with one mode is
Q115: Which is a weakness of the mode?
A)It
Q117: The sum of the deviations around the
Unlock this Answer For Free Now!
View this answer and more for free by performing one of the following actions

Scan the QR code to install the App and get 2 free unlocks

Unlock quizzes for free by uploading documents