Using state data (n = 50)for the year 2000,a statistics student calculated a matrix of correlation coefficients for selected variables describing state averages on the two main scholastic aptitude tests (ACT and SAT).(a)In the spaces provided,write the two-tailed critical values of the correlation coefficient for α = .05 and α = .01 respectively.Show how you derived these critical values.(b)Mark with * all correlations that are significant at α = .05,and mark with ** those that are significant at α = .01.(c)Why might you expect a negative correlation between ACT% and SAT%? (d)Why might you expect a positive correlation between SATQ and SATV? Explain your reasoning.(e)Why is the matrix empty above the diagonal? 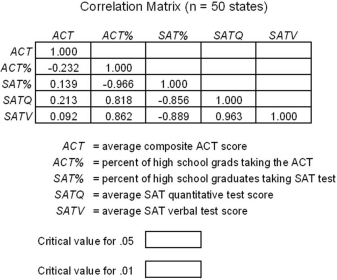
Correct Answer:
Verified
View Answer
Unlock this answer now
Get Access to more Verified Answers free of charge
Q102: In a regression with 7 predictors and
Q102: Analyze the regression results below (n =
Q103: Using data for a large sample of
Q105: The ScamMore Energy Company is attempting to
Q106: The regression equation Salary = 28,000 +
Q107: In a regression with 60 observations and
Q108: The F-test for ANOVA in a regression
Q111: Analyze the regression below (n = 50
Q116: Which Excel function will give the p-value
Q120: A regression with 72 observations and 9
Unlock this Answer For Free Now!
View this answer and more for free by performing one of the following actions

Scan the QR code to install the App and get 2 free unlocks

Unlock quizzes for free by uploading documents