Figure 15-4 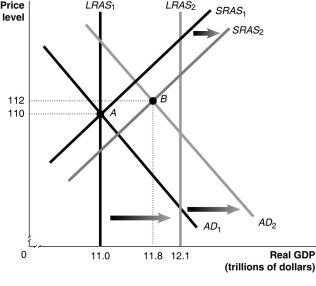
-Refer to Figure 15-4.In the figure above,LRAS1 and SRAS1 denote LRAS and SRAS in year 1,while LRAS2 and SRAS2 denote LRAS and SRAS in year 2.Given the economy is at point A in year 1,what is the growth rate in potential GDP in year 2?
A) 8%
B) 9.1%
C) 10%
D) 12%
Correct Answer:
Verified
Q100: Figure 15-3 Q162: Figure 15-3 Q171: A negative supply shock in the short Q180: Why does the short-run aggregate supply curve Q195: After an unexpected _ in the price Q198: The long-run adjustment to a negative supply Q224: Starting from long-run equilibrium,use the basic aggregate Q231: Figure 15-4 Q235: Which of the following is one reason Q239: Figure 15-4 Unlock this Answer For Free Now! View this answer and more for free by performing one of the following actions Scan the QR code to install the App and get 2 free unlocks Unlock quizzes for free by uploading documents![]()
![]()
![]()
![]()

