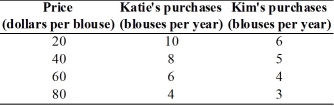
-The table above shows how many blouses Katie and Kim will purchase at different prices for a blouse.In the figure,label the axes and put the price on the y-axis and the quantity of blouses on the x-axis.Plot the data for Katie in the figure.Then,plot the data for Kim in the figure. 
Correct Answer:
Verified
View Answer
Unlock this answer now
Get Access to more Verified Answers free of charge
Q232: Explain whether the statement, ʺHillary Clinton was
Q233: What is the difference between microeconomics and
Q235: What is a normative statement? Give an
Q237: What is the difference between positive and
Q304: List and explain the three fundamental economic
Q306: Pumpkins are grown in New Mexico with
Q317: What is a positive statement? Give an
Q393: What kind of information is conveyed in
Q441: What is the difference between a positive
Q457: Why do economists use graphs?
Unlock this Answer For Free Now!
View this answer and more for free by performing one of the following actions

Scan the QR code to install the App and get 2 free unlocks

Unlock quizzes for free by uploading documents