The map below depicts the annual amount of 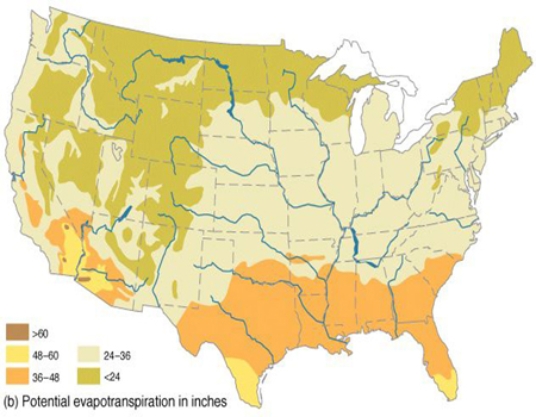
A) precipitation in inches.
B) potential evapotranspiration in inches.
C) humidity in percent.
D) runoff in cubic meters.
Correct Answer:
Verified
Q20: Which of the following is most similar
Q32: Each number on this figure refers to
Q33: Which of the following aquifers require a
Q34: Each number on this figure refers to
Q36: The water balance diagram below suggests that
Q38: During times when precipitation exceeds potential evapotranspiration,
Q40: This water balance diagram for the tropical
Q41: How would this stream interact with groundwater?
Q42: This cross section shows the location of
Q66: Which of the following is true about
Unlock this Answer For Free Now!
View this answer and more for free by performing one of the following actions

Scan the QR code to install the App and get 2 free unlocks

Unlock quizzes for free by uploading documents