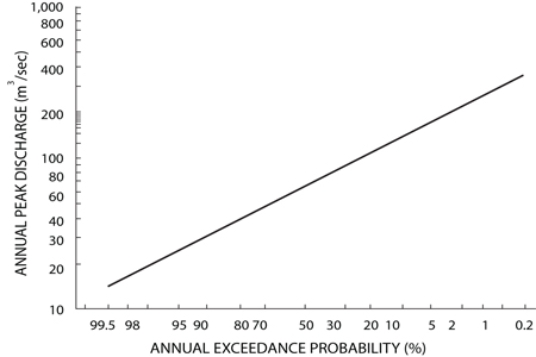
The lowest notch shown on this figure is 9 meters wide and 5 meters high from its base.The river has a velocity of 1 meter per second when it fills the notch.Based on the accompanying graph, what is the probability each year that the notch will be filled to the top? 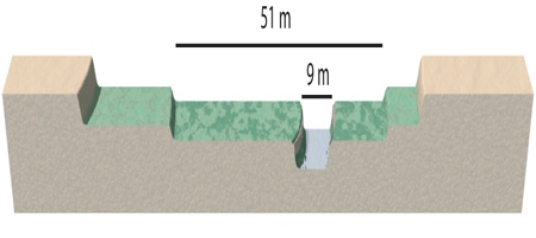
A) 90 to 95%
B) 60 to 80%
C) 40 to 45%
D) less than 40%
E) None of these.
Correct Answer:
Verified
Q85: The lowest notch shown on this figure
Q86: This plot shows the highest flow event
Q88: In the accompanying hydrograph for a major
Q88: What is a stream's discharge rate if
Q89: Using this plot of annual peak discharge,
Q91: Which of the following lessons was illustrated
Q92: Which of the following features is NOT
Q94: Which of the following is true about
Q99: What is the most important data for
Q137: What was the cause of flooding in
Unlock this Answer For Free Now!
View this answer and more for free by performing one of the following actions

Scan the QR code to install the App and get 2 free unlocks

Unlock quizzes for free by uploading documents