Compared with curve 2 on this hydrograph,what is a possible explanation for curve 1? 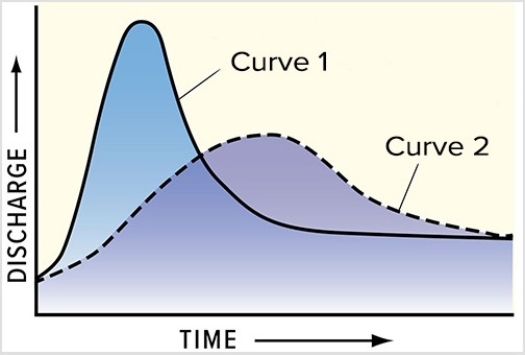
A) The basin for curve 1 has steeper slopes than the basin for curve 2.
B) The storm recorded by curve 1 was shorter and more intense than the storm represented by curve 2.
C) Curve 1 shows the same area as curve 2 but after urbanization.
D) All of these are possible.
Correct Answer:
Verified
Q4: A delta forms when:
A) ocean waves, especially
Q8: What is the pattern of discharge shown
Q9: If erosion and deposition occur at the
Q10: Which of the following is a condition
Q12: Bedrock and sediment in a stream is
Q14: Which of the following is true about
Q15: Based on the accompanying hydrograph,what was the
Q16: The size of clasts that a stream
Q17: In this diagram,water velocity downstream generally
Q28: Which of the following is true about
Unlock this Answer For Free Now!
View this answer and more for free by performing one of the following actions

Scan the QR code to install the App and get 2 free unlocks

Unlock quizzes for free by uploading documents