Exhibit 12-3
Regression analysis was applied between sales data (in $1,000s) and advertising data (in $100s) and the following information was obtained.
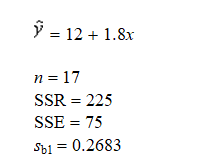
-Refer to Exhibit 12-3. The F statistic computed from the above data is
A) 3
B) 45
C) 48
D) Not enough information is given to answer this question.
Correct Answer:
Verified
Q69: Exhibit 12-6
You are given the following information
Q70: Exhibit 12-3
Regression analysis was applied between sales
Q71: Exhibit 12-5
You are given the following information
Q72: Given below are seven observations collected
Q73: Exhibit 12-4
The following information regarding a dependent
Q75: Exhibit 12-5
You are given the following information
Q76: Exhibit 12-4
The following information regarding a dependent
Q77: Exhibit 12-3
Regression analysis was applied between
Q78: Exhibit 12-3
Regression analysis was applied between
Q79: Exhibit 12-4
The following information regarding a dependent
Unlock this Answer For Free Now!
View this answer and more for free by performing one of the following actions

Scan the QR code to install the App and get 2 free unlocks

Unlock quizzes for free by uploading documents