Multiple Choice
Figure 21-3
In each case, the budget constraint moves from BC-1 to BC-2. 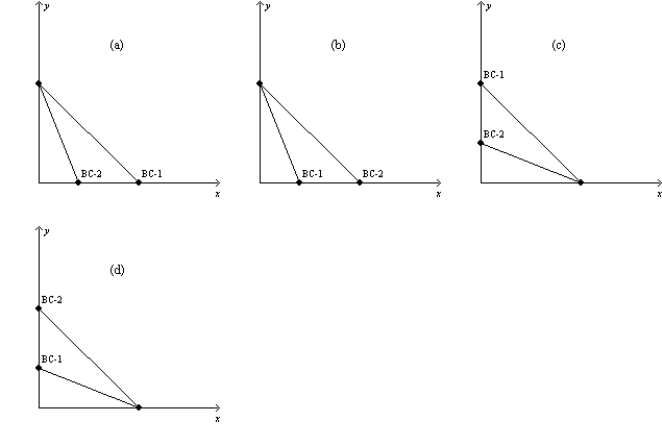
-Refer to Figure 21-3. Which of the graphs in the figure could reflect a simultaneous decrease in the price of good X and increase in the price of good Y?
A) (ii) only
B) (iii) only
C) (ii) or (iv) only
D) None of the above is correct.
Correct Answer:
Verified
Related Questions
Q19: Figure 21-2
The downwardsloping line on the figure
Q23: Figure 21-3
In each case, the budget constraint

