Figure 8-2
The vertical distance between points A and B represents a tax in the market. 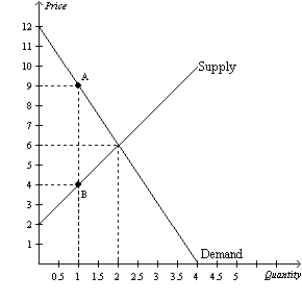
-Refer to Figure 8-2. The loss of consumer surplus for those buyers of the good who continue to buy it after the tax is imposed is
A) $0.
B) $1.50.
C) $3.
D) $4.50.
Correct Answer:
Verified
Q44: In the market for widgets,the supply curve
Q57: The supply curve for motor oil is
Q70: Figure 8-1 Q79: Figure 8-1 Q82: Figure 8-2 Q84: Figure 8-2 Q85: Figure 8-2 Q88: Figure 8-2 Q98: Figure 8-2 Q100: Figure 8-2![]()
![]()
The vertical distance between points A
The vertical distance between points A
The vertical distance between points A
The vertical distance between points A
The vertical distance between points A
The vertical distance between points A
Unlock this Answer For Free Now!
View this answer and more for free by performing one of the following actions

Scan the QR code to install the App and get 2 free unlocks

Unlock quizzes for free by uploading documents