The graph below illustrates which deceptive technique? 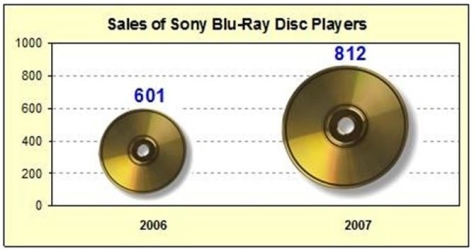
A) Poor Y axis scale
B) Area trick
C) Unclear grid lines
D) Dramatic title
Correct Answer:
Verified
Q64: Which is not a characteristic of using
Q66: Which of these deficiencies would be considered
Q70: The point halfway between the bin limits
Q76: Bob found an error in the following
Q77: The distribution pictured below is 
Q78: Below is a frequency distribution of earnings
Q81: Briefly list strengths and weaknesses of this
Q82: Below is a sorted stem-and-leaf diagram for
Q83: A population is of size 5,500 observations.When
Q84: Here are advertised prices of 23 used
Unlock this Answer For Free Now!
View this answer and more for free by performing one of the following actions

Scan the QR code to install the App and get 2 free unlocks

Unlock quizzes for free by uploading documents