Because most data values are on the left,we would say that this dot plot (burglary rates per 100,000 persons in 350 U.S.cities)shows a distribution that is skewed to the left (negatively skewed). 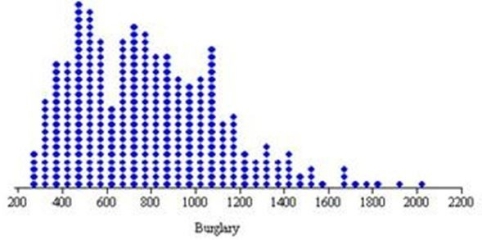
Correct Answer:
Verified
Q21: The zero origin rule may be waived
Q24: A dot plot would be useful in
Q25: A column chart would be least suitable
Q26: The number of bins in this histogram
Q28: Line charts are not used for cross-sectional
Q32: A scatter plot is useful in visualizing
Q34: A scatter plot requires two quantitative variables
Q38: Histograms generally do not reveal the:
A)exact data
Q39: Which criterion is least likely to be
Q40: It is possible to construct a histogram
Unlock this Answer For Free Now!
View this answer and more for free by performing one of the following actions

Scan the QR code to install the App and get 2 free unlocks

Unlock quizzes for free by uploading documents