Referring to this box plot of ice cream fat content,the mean would exceed the median. 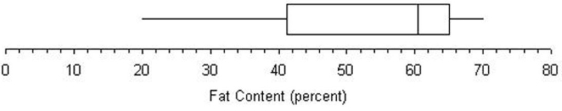
Correct Answer:
Verified
Q22: The range as a measure of variability
Q24: The position of the median is:
A)n/2 in
Q25: Referring to this graph of ice cream
Q26: A sample consists of the following data:
Q27: Referring to this box plot of ice
Q30: A platykurtic distribution is more sharply peaked
Q34: Outliers are data values that fall beyond
Q34: The coefficient of variation is
A)measured on a
Q36: In calculating the sample variance, the sum
Q38: Which is a characteristic of the trimmed
Unlock this Answer For Free Now!
View this answer and more for free by performing one of the following actions

Scan the QR code to install the App and get 2 free unlocks

Unlock quizzes for free by uploading documents