The following graphs display the data points for two linear correlations.Based on the information provided in these graphs,________ displays a negative correlation and ________ displays a stronger correlation. 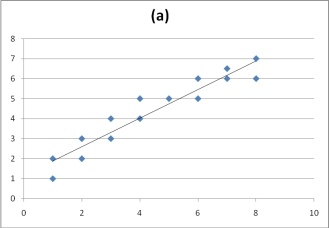
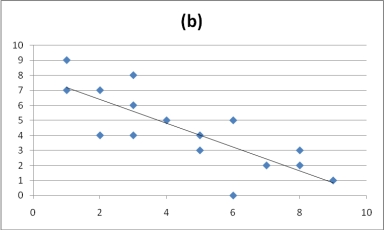
A) Graph A;Graph B
B) Graph B;Graph A
C) Graph A;Graph A
D) Graph B;Graph B
Correct Answer:
Verified
Q7: The correlation coefficient ranges between _
Q13: Suppose a correlation is computed in each
Q14: The denominator of the correlation coefficient measures
Q16: The most common measure of effect size
Q17: The coefficient of determination is
A)a measure of
Q18: The correlation coefficient ranges from -1.0 to
Q20: A researcher measures the following correlation between
Q20: A researcher measures the relationship between two
Q26: The assumption that there is an equal
Q38: Which of the following is a limitation
Unlock this Answer For Free Now!
View this answer and more for free by performing one of the following actions

Scan the QR code to install the App and get 2 free unlocks

Unlock quizzes for free by uploading documents