What kind of relationship is depicted in the following graph? 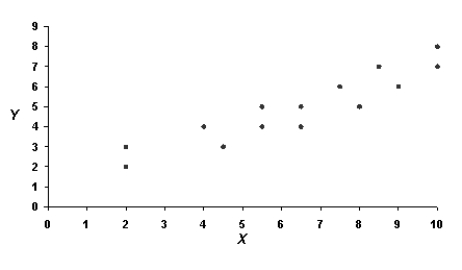
A) A positive linear correlation
B) A negative linear correlation
C) No correlation
D) A nonlinear correlation
Correct Answer:
Verified
Q17: To know whether there is a relationship
Q18: In a linear relationship,as the X scores
Q19: If you see the notation 
Q20: "The more you save,the less you spend"
Q21: In general,a zero correlation means that
A)as the
Q23: Which relationship is stronger,r = +0.62 or
Q24: What type of relationship does the following
Q25: What kind of relationship is depicted in
Q26: A "weak" relationship between two variables is
Q27: Which of the following r-values indicates the
Unlock this Answer For Free Now!
View this answer and more for free by performing one of the following actions

Scan the QR code to install the App and get 2 free unlocks

Unlock quizzes for free by uploading documents